Scope 3 emissions told in a single graphic

Here’s a note from Harvard Business School’s George Serafeim:
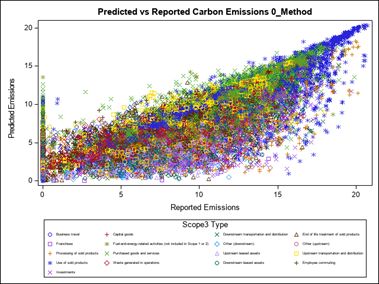
Scope 3 carbon emissions still represent an item that many companies struggle with. At the same time this is where majority of emissions occur for most industries. There are 15 types and they occur both upstream in the supply chain and downstream in the process of product sale.
Here is a simple graph showing the magnitude of each type across a sample of 180,000 reported scope 3 types by companies over years (logged emissions to scale). On the vertical axis we can see the magnitude of the predicted scope 3 types based on a machine learning model (random forests). The model would predict carbon under-reporting across many scope 3 types. This is a graph from a forthcoming scope 3 measurement and analysis paper.
